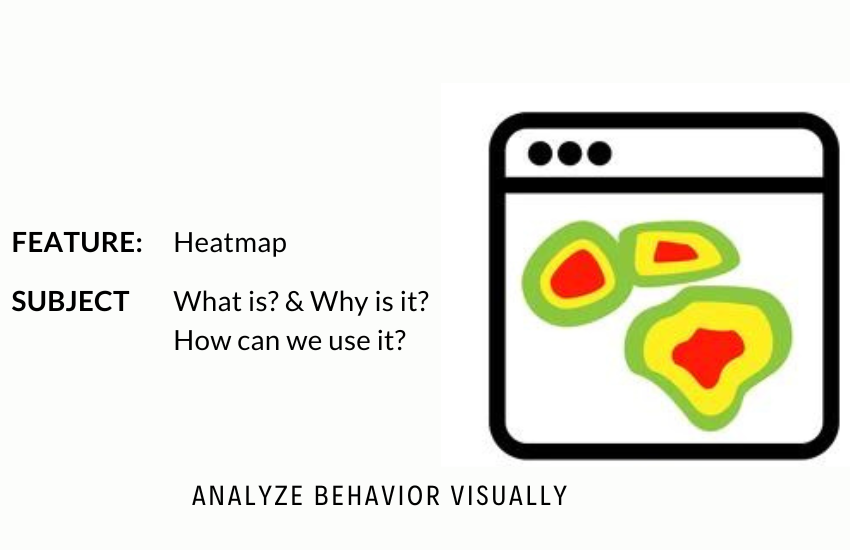
What is Heatmap? Why is it? How can we use it?

In the world of web analytics, a heatmap is like a secret decoder revealing the hidden patterns of user behavior on your website. Let’s dive into the fascinating world of heatmaps – what they are, why they matter, and how you can harness their power for a smarter, more user-friendly online presence.
What is a Heatmap?
A heatmap is a visual representation of data where values are depicted through color variations. In the context of web analytics, heatmaps show the intensity of user interactions on different areas of a webpage. The warmer the color, the more activity a particular area receives.
Why Do Heatmaps Matter?
Visual Insight into User Behavior: Heatmaps provide a clear and intuitive visual representation of where users are clicking, moving, and spending the most time on your website.
Optimizing User Experience (UX): By understanding how users engage with your site, you can identify popular sections, elements, or potential pain points. This knowledge is crucial for enhancing overall user experience.
Page Optimization: Heatmaps reveal which elements are attracting attention and which may be overlooked. This insight helps in optimizing the layout, placing essential elements strategically, and improving overall page design.
Content Effectiveness: Analyzing heatmaps can shed light on the effectiveness of your content. Are users reaching the end of your blog posts? Clicking on your CTAs? Heatmaps provide valuable data for content strategy.
How Can You Use Heatmaps?
Click Heatmaps: Understand where users are clicking the most. This helps in evaluating the effectiveness of buttons, links, and calls to action.
Scroll Heatmaps: Visualize how far users are scrolling down your pages. Identify where they lose interest or abandon the page.
Move Heatmaps: Track the movement of the cursor to understand the user’s focus. Are they hovering over specific images or sections?
Segmentation: Heatmaps can be segmented based on user demographics or behavior, providing a more targeted analysis.
Shotcut Track can integrate with any CMS like WordPress, Shopify, WIX, Squarespace and many more.
Implementing Heatmaps in Shotcut Track:
Access the Heatmap Feature: Log in to your Shotcut Track account and navigate to the ‘Heatmaps’ section.
Create Heatmap: Click create heatmaps for the specific insights you’re seeking.
Analyze the Data: Once your heatmap is generated, pay attention to the color intensity. Hotspots represent areas with high interaction.
Optimize Your Website: Use the insights gained to make informed decisions about design, content placement, and overall user flow. Test changes and monitor their impact.
In conclusion, heatmaps are like the X-ray vision for your website, allowing you to see beneath the surface and understand user behavior in a way that raw data alone cannot convey. By integrating heatmaps into your web analytics toolkit, you gain a powerful tool for refining your site, improving user satisfaction, and achieving your online objectives.


